Waste and recycling statistics
In addition to collecting waste from the kerbside, we also collect waste:
- at the Household Waste Recycling Centre (HWRC) at Barkers Lane
- as part of our Bulky Waste collection service
- at our network of local recycling sites
- in litter bins across Bedford Borough
- in our street sweeping vehicles
We measure the amount of household rubbish and recycling we collect by weight. Every quarter we send this information to Defra (Department for Environment, Food & Rural Affairs) using a tool called WasteDataFlow.
Anyone can register for public access to the information held in WasteDataFlow. You can run reports on the waste and recycling figures reported by all the local authorities in the UK.
Weight of recycling and waste collected
Between April 2026 and June 2026, we collected:
- 7,603 tonnes of general waste (black bins).
- 3,298 tonnes of recycling (orange lidded bins).
- 3,756 tonnes of garden waste (green lidded bins)
This means on approximately on average each household in the Borough produced:
- 94 kg of general waste
- 41 kg of recycling waste
- 46 kg of garden waste
How much household waste do we collect?
This and previous years (1 April – 31 March).
| Type of collection |
2021/22 |
2022/23 |
2023/24 |
2024/25 |
2025/26 |
| General waste |
37,799 tonnes |
36,165 tonnes |
36,643 tonnes |
37,296 tonnes |
36,646 tonnes |
| Recycling |
11,414 tonnes |
10,699 tonnes |
10,696 tonnes |
10,828 tonnes |
11,774 tonnes |
| Garden waste |
12,470 tonnes |
9,918 tonnes |
12,580 tonnes |
11,474 tonnes |
9,649 tonnes |
| Food waste from outdoor food bins |
N/A |
N/A |
N/A |
N/A |
Started 30 March 2026 |
Recycling rate
The recycling rate shows the percentage of household waste recycled, reused or composted out of the total weight of all recycling, garden waste and rubbish we collect from our residents.
Quarterly recycling performance
Recycling performance is very dependant upon the weather as a significant proportion of the waste we collect is garden waste. You will notice the negative impact the very dry Spring/Summer in 2022 and 2024 has had in the recycling performance figures for these.
| Date |
2022/23 |
2023/24 |
2024/25 |
2025/26 |
2026/27 |
| April to June (Q1) |
39.2% |
44.3% |
41.9% |
40.4% |
48.83% |
| July to September (Q2) |
37.8% |
41.0% |
38.8% |
36.9% |
|
| October to December (Q3) |
34.5% |
34.2% |
34.5% |
34.7% |
|
| January to March (Q4) |
30.8% |
30.4% |
30.4% |
32.4% |
|
| Yearly total |
35.7% |
38.0% |
36.8% |
36.3% |
48.83% |
Garden waste collections run from 30 March to 1 November each year. A dry summer can significantly impact the amount of garden waste collected and recycled. This can be seen in the recycling rates, especially during the summers of 2022 and 2024.
Glass bottles and jars have been collected from orange-lidded bins since December 2025. The impact of this can be seen in Q4 of 2025/26.
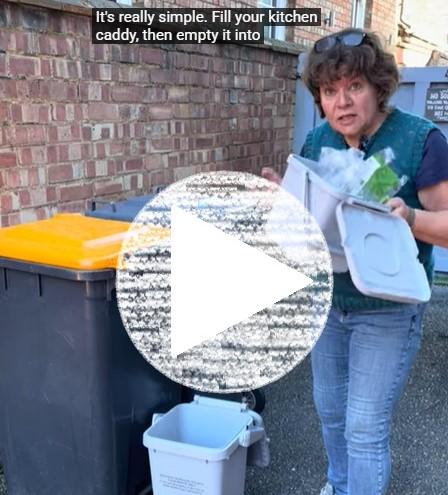
Food waste collections began at the end of March 2026. The impact of this can be seen from Q1 2026/27.
Help us recycle more
- Check what goes in each bin if you’re unsure about an item.
- Keep recycling for your orange-lidded bin clean and loose, and don’t put the wrong items in there.
- Use your food waste caddy for food scraps and leftovers.
- Find ideas to reduce, reuse and recycle your household waste.
Subscribe to email bulletins
You can subscribe to email bulletins for bin collection updates and recycling tips.
Subscribe to email bulletins