What happens to your recycling and rubbish

Bedford Borough Council takes care to ensure all waste is handled safely and responsibly so that as much as possible gets recycled. 

We put all the recycling and rubbish we collect through a variety of treatments and processes to make sure as little as possible is wasted.

How we handle different types of waste

Recyclable items from your orange lidded bins and local recycling sites

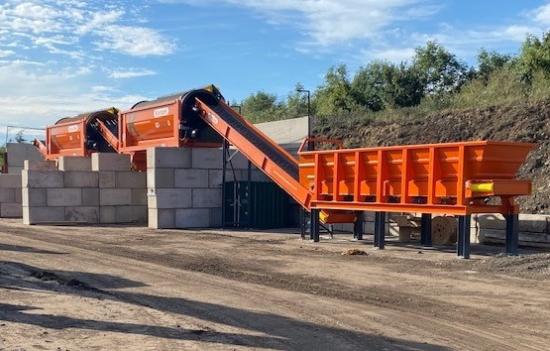
Since October 2021 all of the recycling collected in your orange lidded bins has been sent to a recycling facility near Grantham in Lincolnshire to be sorted. A variety of magnets, currents, size-sorting equipment and conveyor belts separate the different materials into single streams. They are then baled and sold to reprocessors who melt, pulp or crush them to make new products.

<

In 2023 all the recyclables collected by the Council were sorted in the UK. These materials were then sold on to re-processors and manufacturers to become new materials and products. 

Where material has been exported, the locations it was sent to are all fully licensed and operate to environmental standards.

The exported materials had already been sorted and were high-quality materials ready to be made into new products.

  • Paper and cardboard are sorted into different grades and sent to mills to be pulped and made into new paper and card products.
  • Cans are separated into aluminium and steel. Then they are melted by processors to form ingots, which are sold to manufacturers who can make anything from new drinks cans to aeroplanes.
  • Plastic bottles, pots, tubs and trays are sorted to separate the different polymer types. They are shredded and cleaned, then melted into pellets. These are sold to manufacturers to make new plastic packaging, garden furniture and even fleece jackets.
  • Textiles from local recycling sites are sorted and reused, in some cases raising money for the charities that sponsor the bins. Many items are reused in the UK, but most are sent to Africa or Eastern Europe.
  • Glass from local recycling sites is melted and used to make new bottles. Metal bottle tops and lids are also separated and recycled as part of this process.

Between 18% and 20% of the materials put in the orange lidded bin by residents are unfortunately not recyclable for example food, textiles, sanitary/nappy waste, wet paper and wood. This non-recyclable material is separated, processed into SRF (Solid Recovered Fuel) and burnt in cement kilns as an alternative to coal.

Garden waste from your green lidded bins

Image
Composter machine

Your garden waste (including real Christmas trees) is sent to a local composting facility operated by Growing Beds Ltd in Ravensden where it is made into compost. 

The garden waste is shredded and then piled into windrows to undergo a sterilisation process. Each windrow is turned four or five times to ensure all material is heated to the correct temperature for sterilisation.

It is then sorted into three sizes using a trommel:

  1. 0 to 10mm horticultural grade PAS100 compost
  2. 10 to 30mm agricultural grade PAS100 compost
  3. The remaining compost oversize / wood faction is reprocessed with new incoming waste to provide a source of carbon during the sterilisation phases

Non-recyclable rubbish from your black lidded bins

We take your black bin rubbish to an Energy from Waste (EfW) facility in Stewartby, Bedfordshire.

The facility extracts metals for recycling before thermally treating the remaining waste to provide the steam to generate electricity.

None of the black bin general rubbish collected in Bedford Borough goes to landfill sites which are harmful to the local environment and produce methane, a powerful climate gas.

Find out more about the facility or arrange a tour of the new visitor centre.

Waste and recycling statistics

In addition to collecting waste from the kerbside, we also collect waste:

  • at the Household Waste Recycling Centre (HWRC) at Barkers Lane
  • as part of our Bulky Waste collection service
  • at our network of local recycling sites
  • in litter bins across Bedford Borough
  • in our street sweeping vehicles

We measure the amount of household rubbish and recycling we collect by weight. Every quarter we send this information to Defra (Department for environment, food and rural affairs) using a tool called WasteDataFlow.

Anyone can register for public access to the information held in WasteDataFlow. You can run reports on the waste and recycling figures reported by all the local authorities in the UK.

Weight of recycling and waste collected

Between April 2021 and March 2022 we collected:

  • 37,799 tonnes of general waste (black bins) from 77,650 households – an average of 487kg per household per year. This is the equivalent weight of 3,048 double decker Routemaster London buses.
  • 11,414 tonnes of recycling (orange lidded bins) from 77,650 households – an average of 147kg per household per year.
  • 12,470 tonnes of garden waste (green lidded bins) from 77,650 households – an average of 161kg per household per year.
Type of collection 2018/19 2019/20 2020/21 2021/22 2022/23
General waste 34,519 tonnes 34,568 tonnes 39,258 tonnes 37,799 tonnes 36,165 tonnes
Recycling 11,034 tonnes 10,805 tonnes 11,696 tonnes 11,414 tonnes 10,699 tonnes
Garden waste 10,745 tonnes 10,988 tonnes 11,065 tonnes 12,470 tonnes 9,918 tonnes

Recycling rate

The recycling rate shows the percentage of waste recycled, reused or composted out of the total weight of all recycling, garden waste and rubbish we collect from our residents.

Quarterly recycling performance

Recycling performance is very dependant upon the weather as a significant proportion of the waste we collect is garden waste. You will notice the negative impact the very dry Spring/Summer in 2022 has had in the recycling performance figures for 2022/23.

Date 2018/19 2019/20 2020/21 2021/22 2022/23
April to June (Q1) 48.6% 45.5% 44.4% 41.1% 39.2%
July to September (Q2) 45.1% 46.9% 45.7% 42.1% 37.8%
October to December (Q3) 40.9% 40.8% 37.9% 33.0% 34.5%
January to March (Q4) 34.8% 36.4% 31.4% 29.4% 30.8%
Yearly total 42.9% 42.7%. 40.0% 37.0% 35.7%